Managing Rating Curves
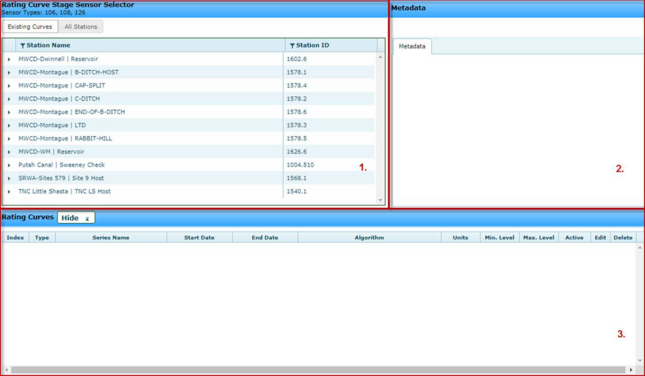
The tool is broken up into three sections:
1. Measurement section – where stage data is sorted by project and station in a hierarchical grid. Drill down to select a valid stage series.
2. Metadata display – shows the associated Metadata for any series selected in the Measurement Section.
3. Rating Curve Display – shows the polynomials or power relationships associated with a selected stage measurement and allows a user to add or edit these curves.
With the Existing Curves tab highlighted, the Measurement Section shows all projects that already have rating curves by default.
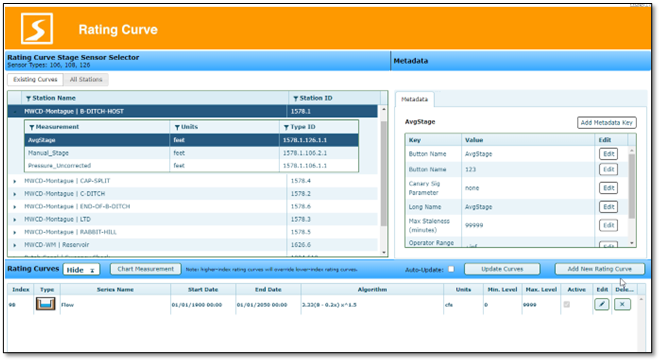
To access an existing rating curve, click to open the Station and then click on the sensor row. The rating curve definition will show up in the Rating Curve Display.