Features
The workspace allows you to view, edit the date range, save and export one or more data series. The main features of the WorkSpace are described below:
  |
These buttons are for saving, loading and editing the list to a template. You can name a frequently used selection of series and save it in a template so that you can later retrieve the list without having to select the list again. (See below for further information on Templates).
|
 |
This button charts up to eleven series in a single graph. The multi-axis chart option (the checkbox (R) next to the Chart All Button) will create a plot with each series with its own unique Y-axis.
|
 |
This button exports the data series to a spreadsheet csv file for an external application. A form will ask the user whether they want to export to a normal or pivoted dataset. By default, the data is exported in its raw form without processing (gap filling or timestep normalization).
|
 |
This button will empty the workspace of all selected series
|
 |
QA Button – This button plots the single series in a QA/QC graph. This tool allows the user to filter bad points and set quality codes for the series (see below).
|
 |
Chart Button – This button rapidly plots the single series in a chart that can be used to review the series and save as a graphic for sharing.
|
 |
Export Button– This button exports a single series as a csv file.
|
 |
Edit Button– This button adjusts the date range of a single series or for every series in the Workspace for analysis or exporting purposes. The modified date range can be saved to a Template. The original date range is not affected.
|
 |
Calc Button – This button is used to retrieve the native begin and end data of the data series from the database. After this button is used you must use the Edit form to reset the date range displayed in the Workspace to the native range.
|
 |
Delete Button - This button removes the series data from the list.
|

There are up to 15 series allowed in your workspace, only 10 can be charted in a Multi-Axis chart.
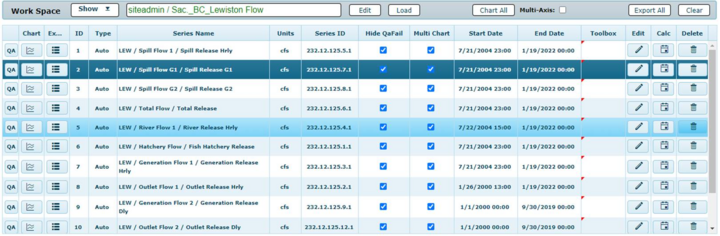
The columns in the Workspace are defined below:
· “ID” is a consecutive number assigned when the series is added to the Workspace. It defines the order the series are plotted in a chart or exported in a pivot table.
· “Type” defines the type of data series as defined at the ‘Sensor’ level in the database (this setting can only be set at via Merlin Enterprise). They control how the series is plotted using the single graph button, and whether they are viable for gap-filling. Options are: Auto, Bar, Manual, Profile, Step. Only “Auto” – which is defined as time series with a regular periodic time step can be gap filled.
· “Series Name” is a concatenation (separated by ‘/’ ) of the Station Name, Array Name and Measurement Name.
· “Units” are the units of measurement
· “Series ID” is the TypeID or ‘serial number’ of the data series in the database. It is a concatenation (separated by ‘.’) of Project Number, Station Number, Array Type, SensorID and Measurement No.
· “Hide QA Fail” is a checkbox that when checked prevents data flagged as having failed a QA filter from being displayed or exported in the Workspace or Toolbox.
· “Multi-Chart” is a checkbox that adds or removed (when unchecked) a series from being displayed when using the “Chart All” function.
· “Start Date” and “End Date” are the beginning and ending of the data series. When a series is loaded directly from the database into the Workspace this is the native date range. This date range can be modified and saved in a Template.
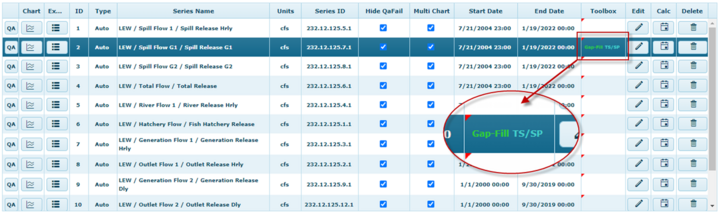
· “Toolbox” defines what is any processing has been applied to the series in the Toolbox. This includes:
o “Gap-Fill” means the user picks an algorithm for gap filling in the Gap Handling Tool
o “TS/SP” or “TS/Avg” means user increases the timestep. SP represents a single point. Avg represents average value.
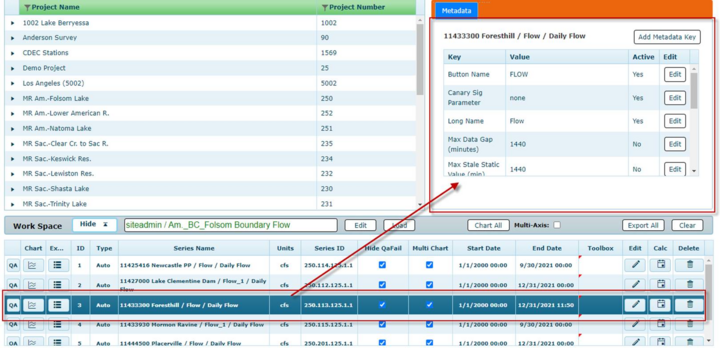
When a user clicks a data series in the Work Space, they can also see the metadata of that data series in the metadata window.