Creating NEW Curves
Switch to All Stations to see a list of all stations and measurements. To add a new rating curve:
1. Select a station and the measurement that you would like to create curves in.
2. Once a sensor is selected, the bottom “workspace” will show up with all the rating curves applied to that sensor. If no curves are applied, nothing will show up in your workspace.
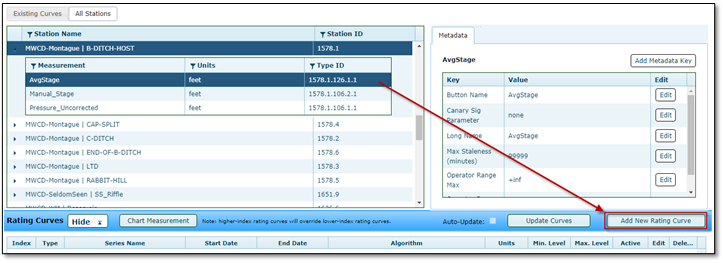
3. Select Add New Rating Curve and a form will pop-up:
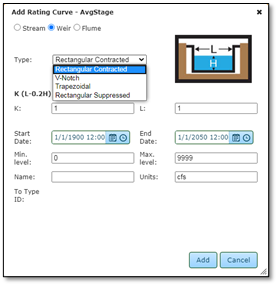
4. Before filling out the associated fields, select the type of algorithm to apply:
|
Hydraulic Structures
|
Types
|
|
Stream
|
Polynomial
|
|
Power
| |
|
Weir
|
Rectangular Contracted
|
|
Rectangular Suppressed
| |
|
V-Notch
| |
|
Trapezoidal
| |
|
Flume
|
Parshall
|
5. Fill out the appropriate parameters for the equation and select:
a. Start Date
b. End Date
c. Minimum value
d. Maximum value
The Minimum and Maximum values refer to the stage range you want to apply the curve to.
6. Name your curve and type in the Units for this measurement.
7. Click Save. Your rating curve will now show up in the display grid.
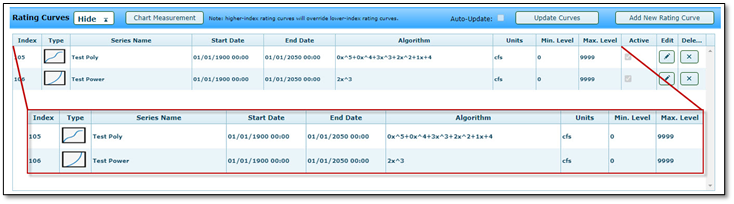
Rating curves change as a result of a change in geometry of the channel – both physically and temporally. A user can enter different rating curves into the rating curve table and specify the applicable date range and or stage level the equation should be applied to. When plotting or exporting the calculated flows, the polynomials are applied to the appropriate data in terms of date range and stage level. If the equations overlap –they will be processed so that the curve at the higher index overrides the curve at the lower index.
In the following table, the two rating curves – one a poly and one a power – are applied based the stage level.