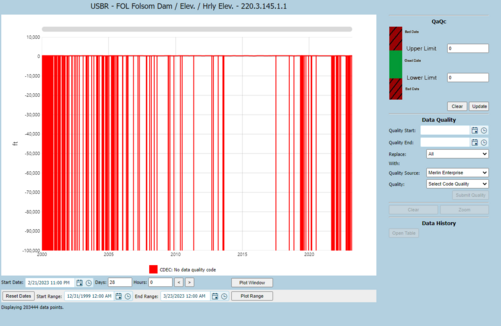
Bad Data Flagging
The QA/QC Tool can be used to apply Quality Pass/Fail flags to the data. A measurement flagged as QA Fail will not show up on charts, tables and reports but will still remain in the database. Both SiteHawk and the Data Library provide access to the QA/QC tool by clicking on the QA button  .
.
.The QA/QC tool flags data that falls outside of a user set limit defined by “Upper” and “Lower” Limits. Values in the QA/QC plot window that fall outside of that defined range are flagged “QA/QC Fail” and are not considered when charts or reports are created
The default chart range is 28 days which emphasizes the most recent data. Data that falls outside this range can be plotted by paginating through the data 28 days or any user settable number of days using the left and right arrows below the plot (< >), or by changing the Start and End dates of the plot.
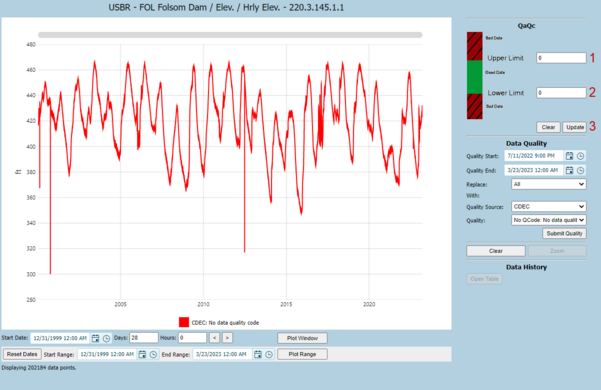
Referring to the following image, The Quality Pass/Fail tool (upper right) contains the following:
1. Upper Limit: This control can be used to set an “upper limit” for QA/QC flagging.
2. Lower Limit: This control can be used to set a “lower limit” for QA/QC flagging.
3. Update and Clear QA/QC Flags: These buttons either apply or clear Quality flags for the given date range.
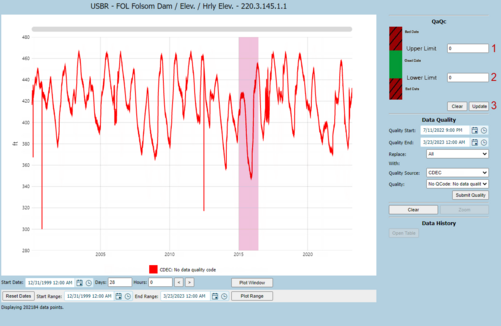
Users can drag and click on the graph to zoom in on a specific time interval.
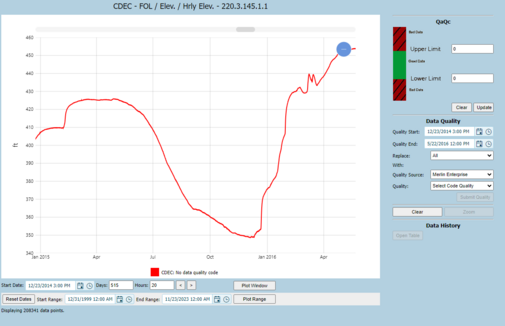
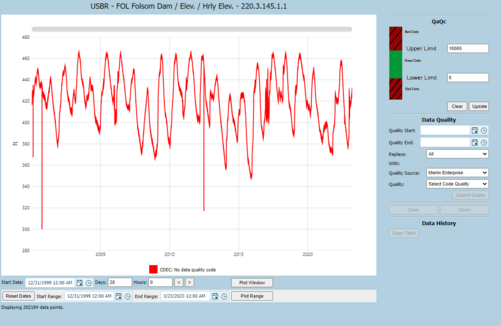
The chart below shows the bad data removed by setting the upper limit 10000 and the lower limit to 0, and clicking Update.