
Using the Filter Buttons
By using the Filter Buttons located above the map, the user can constrain the display to only reveal stations with a certain type of sensor. Once the display is filtered, each station will display the last values for the given sensor, and pop-up thumbnail charts will appear when the user mouses over a station or selects the measurement. (See Figure below)
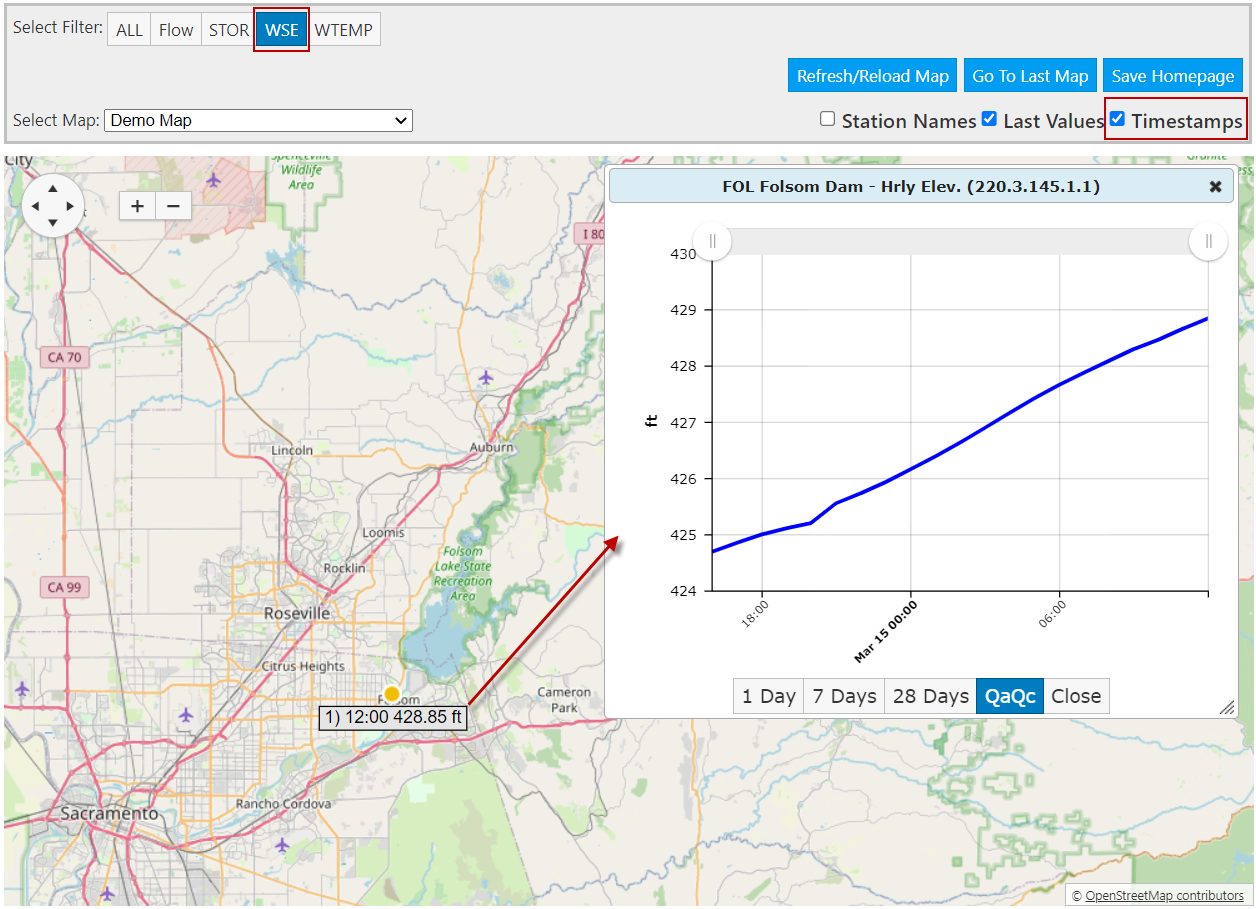
In the image above, the 'WSE’ Filter Button was selected to show only water surface elevation measurements. The Filter button will be shaded and the information bar underneath the Filter button shows the filter currently applied to the display and the units of measure for each value. By default, only the last value will be shown. The “Show Timestamps” checkbox can be selected to display both the time and value of the last data received.
When a user clicks on a last value, a modal chart will appear of the measurement. This is the same chart that gets generated when a user is viewing all measurement types.