
Filling GAPS
The most important issue is filling large gaps that cannot be filled with the gap filling tool, so the first thing we need to accomplish is reviewing data sets with gaps. The attached report will have a red “Y” in the column “Has Gap?”. Please use the Gap Tool to plot these series and determine if the remaining gaps are small enough to use linear interpolation – or whether extra data is needed.
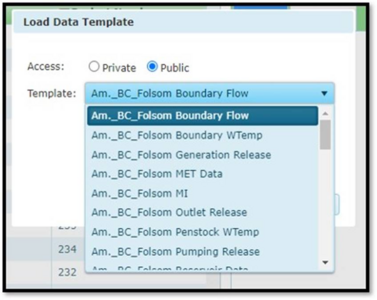
You can find the same Templates named in the report in the Load Template dropdown in the Data Library. For example, in the report above the second line – Lake Clementine Dam – has a “Y” in the “Has Gaps?” column –
1. Load the Template
2. Select the data series which will open the Toolbox
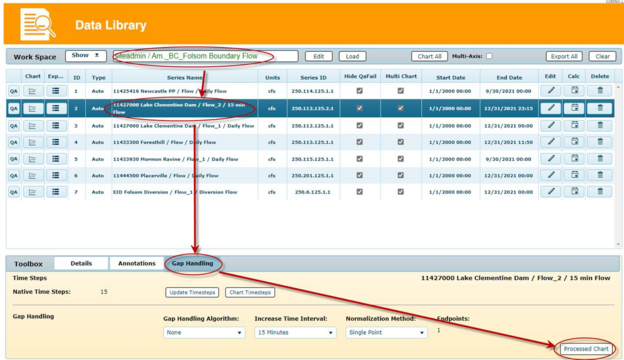
3. Go to the Gap Handling tab and click on “Processed Chart”
4. Review the data to determine whether or not Linear Interpolation can be used.
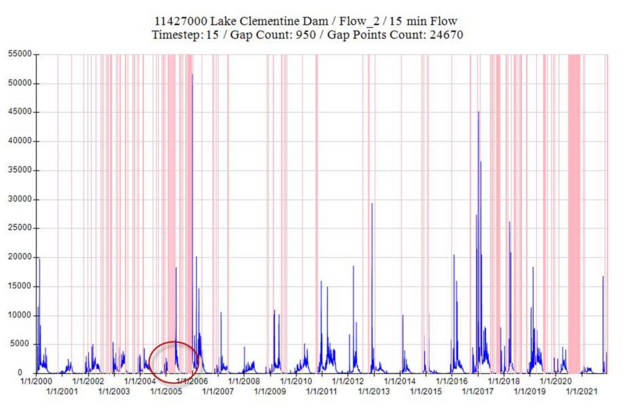
In most cases small gaps that are a few points between well defined and acceptable endpoints can be filled by linear interpolation. This series is a difficult one because it has several sizable gaps. The more problematic one is circled in red. Here the gap occurs where seasonal flows are usually occurring in a somewhat variable way (when comparing to other years. Filling the gap creates a nice smooth curve, but this may not be close to what really happened:
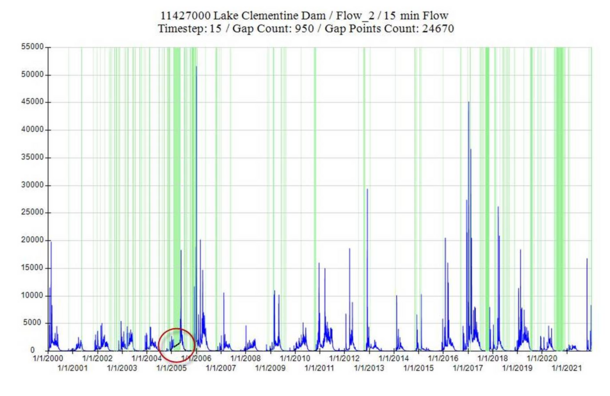
Sometimes you have to change the date range to get a better view.
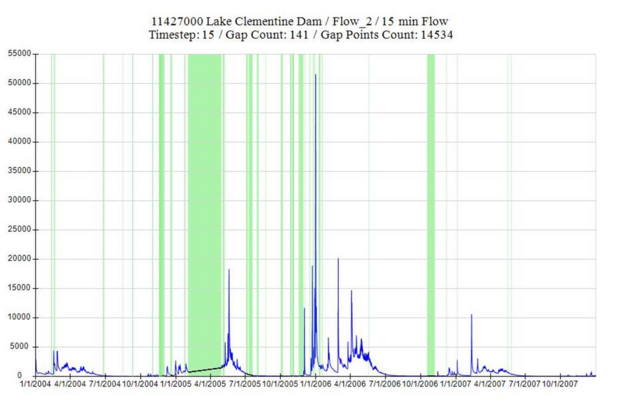
WE MUST DO THIS EVALUATION FOR EVERY DATA SERIES THAT HAS GAPS – AND DECIDE HOW TO FILL LARGE GAPS WHERE LINEAR INTERPOLATION WILL NOT WORK.
Large Gaps - those that can't be addressed using the Gap Handling tool, are filled by importing data, often synthetic data or data obtained from similar data series. The data is imported in Eyasco Format with Quality Codes assigned that flag the data as "gap-filled" and indicate who or what entity provided the data.