
Data History
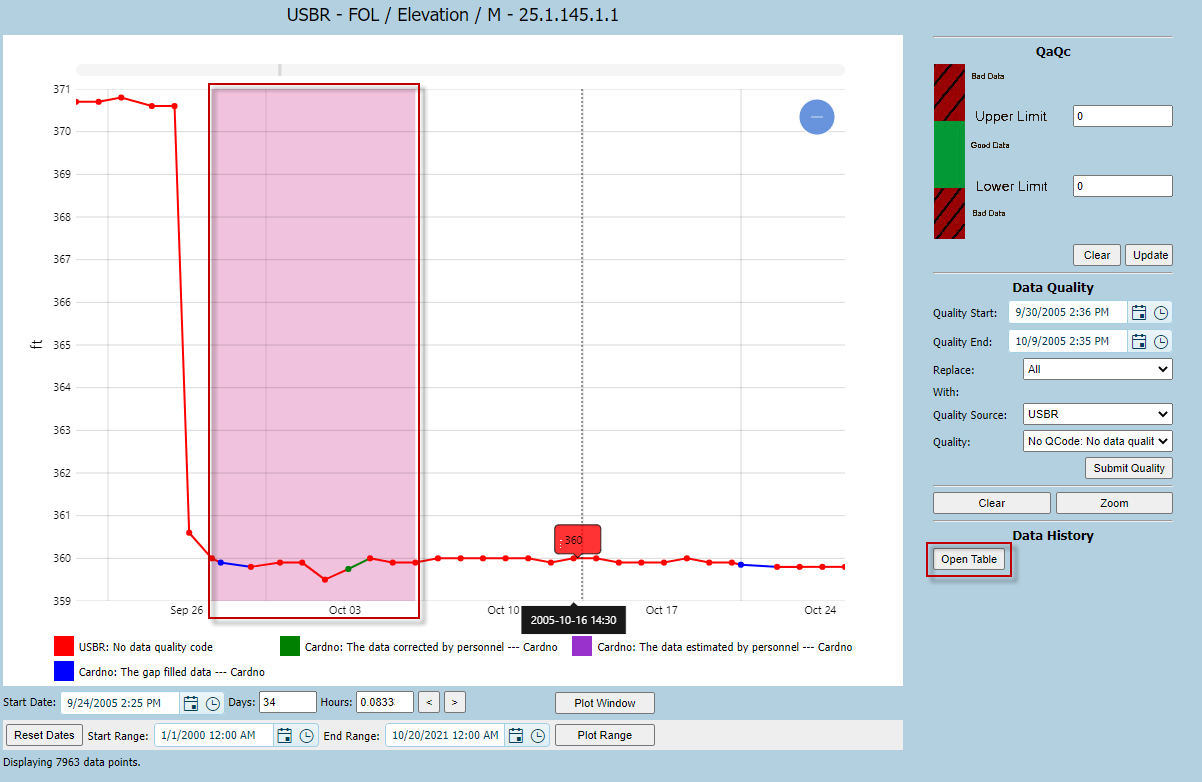
Select the data points in the data plot. This is shown as the pink area in the screenshot below. Click the ‘Open Table’ button to open a pop-up window shows the details of the selected data points.
The pop-up window shows the data points in selected area. Click the expand arrow button to see the changing history of each point.
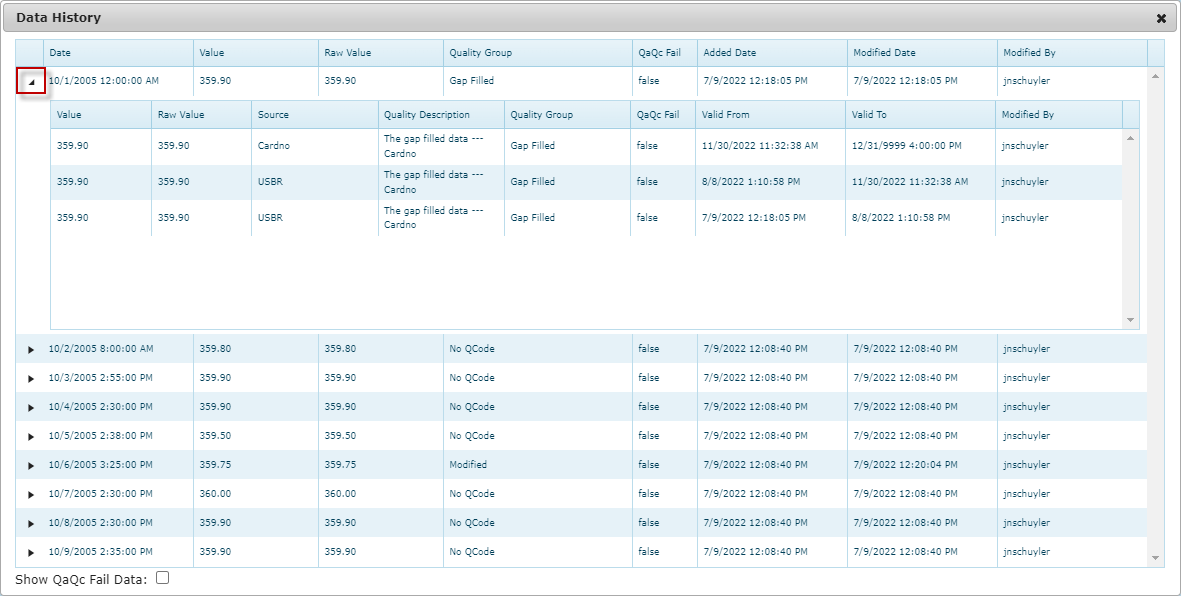
There is a check box at the left bottom corner to show or hide the QaQc fail data points.