
What Is a Rating Curve?
A rating curve is a relationship between stage (water level) and flow or discharge at a cross section of a river or stream. Stage is the height of a water surface above an established point and flow (or discharge) is the volume of water moving down a stream or river per unit of time. Flow values can be obtained by applying these rating curve formulas to stage measurements.

In the example above the discharge is 40 cubic feet per second (cfs) when the stage equals 3.3 feet. The dots on the curve represent measurements (concurrent) of stage and discharge used to develop the curve.
To develop a rating curve, flow measurements are taken manually at different stage levels. This is because the slope or curve of a river bank can change enough with water depth so that the relationship between water height and flow is non-linear. This process is called "rating" the stream. Historically log relationships were used to create the rating curves because they resulted in a near straight line on a log plot. However, in more recent years polynomial equations have gained favor due their ability to better handle low-flow conditions.
If the channel geometry changes enough then more than one rating curve at a specific location may be necessary. For example, the picture below illustrates how there can be different volumes of water depending on the shape of the river bank, and there may be one rating curve for water heights less than 2 feet, and another for water levels greater than 2 feet.

Change in channel geometry also creates different stage-flow relationships. If the geometry of the river channel changes due to erosion or deposition of sediment at the stage measurement site then a new rating curve has to be developed. Over time then a specific rated location will have many rating curves. Deriving historic or real-time flow from these curves requires application of the correct rating based on the stage values and/or the date and time.
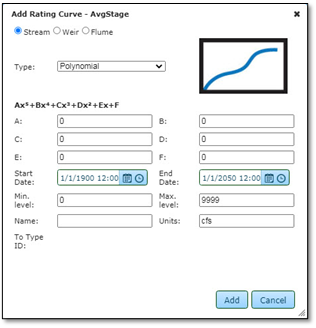
The Rating Curve forms for both polynomial and power regressions are shown below:
|
Types
|
Add Rating Curve Window
|
|
Polynomial
|
 |
|
Power
|
 |