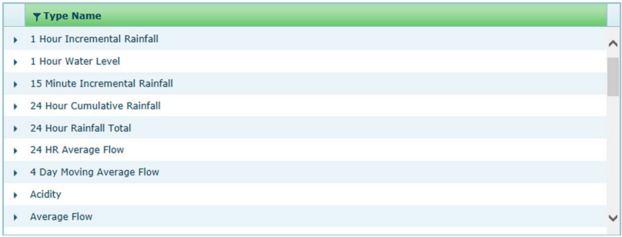
The Data Series Selector
The data series selector is used to select one or more series into a workspace. Once in the workspace, data can be charted, exported, and manipulated in various ways. Metadata can also be viewed and edited depending on what is selected in the data series selector. There are two tabs above the data selector that represent different ways data is grouped:
By Project: This method uses the “Project-Station-Array-Measurement” that is inherent in all Merlin organized data.
The following figures illustrate data collected by project name, some of the names contain names of stations whose data are hand recorded and entered manually.
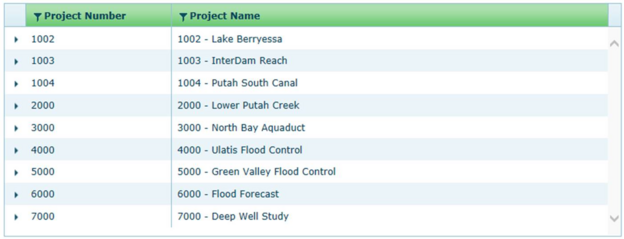
Further expanding the project name will drop down a list of stations associated with the project. These stations are either physical stations or stations where data are collected by hand and entered into the database. Expanding a selection under Stations divulges the different measurements or “sensors” that are at the Station.
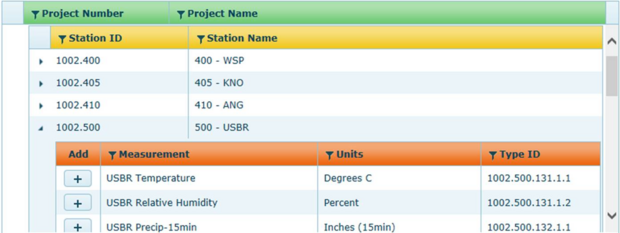
Notice the rows are colored according to the level you drill down to:
Green – Project
Yellow – Station
Red - Measurement
This is important because the Metadata window will show these same colors in relation to these levels.
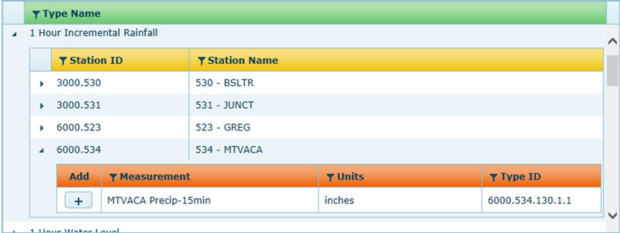
By Type: The 'Type' refers to the actual measurement as defined in a sensors metadata called “Long Name”. The “Long Name” metadata fields in the sensors Metadata table must be filled out to be able to use this grouping. There is usually a default long name that is is assigned when the sensor is first created, but it is also editable by a user in the Metadata tab. In the example below we expand “1 Hour Incremental Rainfall” to find Stations (Yellow) that have those ‘type’ measurements. Expanding the station exposes those measurements at that station.