
Reports for Data Processing
Tabular Gap Summary Report
The Tabular Gap report is in Grabdata2 website -> Report -> USBR Reports. The report only displays the data set which sensor type is ‘Auto’. Otherwise, the data sets will not be displayed in the report. The ‘Templates’ dropdown list shows the public templates which are assigned to your account by site administrator.
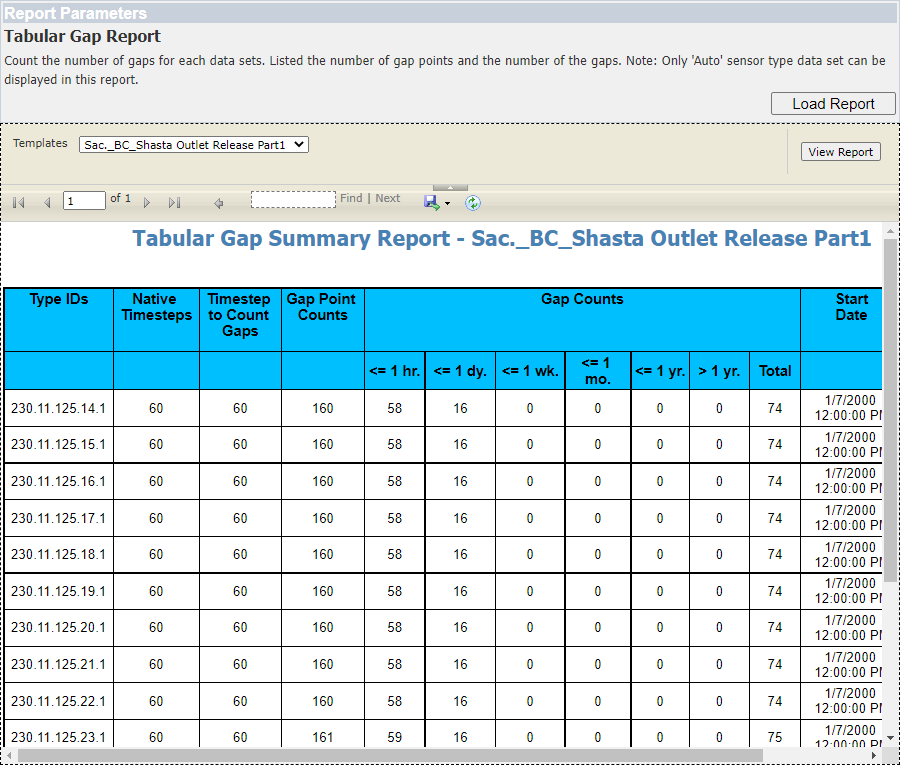
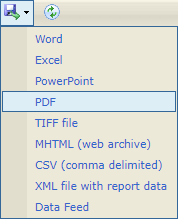
The report can be exported into PDF file.
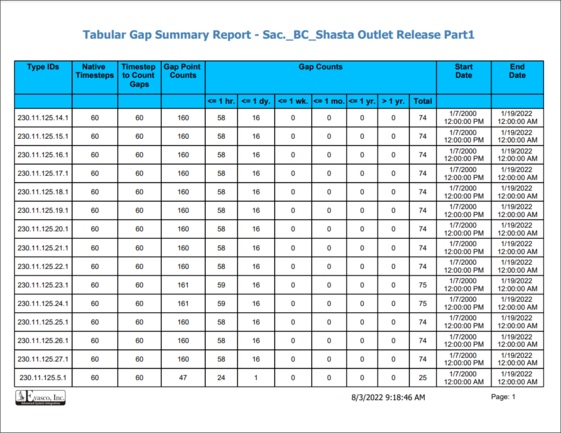
The columns in the Tabular Gap Report:
1. Type IDs
A Type ID is a unique identification number for a measurement that reflects the Project, Station, Sensor Type, and Sensor ID to which it is attached. The basic format for a type ID is:
Project.Station.ArrayType.SensorID.MeasurementID
A Type ID of 230.11.145.2.1 belongs to Project 230, Station 11, Sensor 2 and is the first measurement on that Sensor. The 145 indicates that the Sensor Array is a single level array.
A set of type IDs that begin with 230 are all a part of project 230. A group of type IDs that all begin with 230.11.xx.xx.xx all belong to the same station. A group of Type IDs that have identical values in the third position (xx.xx.160.xx.xx) are all the same type of sensor.
2. Native Timesteps
Native timesteps shows the significant timesteps in the data set. If a data set has both hourly data and daily data the display shows two native timesteps of 60 minutes and 1440 minutes.
3. Timestep to Count Gaps
The ‘Timestep to count gaps’ column shows the timestep used to detect the gaps. It is always same as the Native Timesteps when the data set only has one timestep. When there are two or more timesteps, the report will use the largest timestep to detect gaps.
The maximum timestep allowed in this column is 1440 for now. This setting can be changed in the stored procedure if needed.
4. Gap Point Counts
Gap Point Counts column shows the number of single gap points.
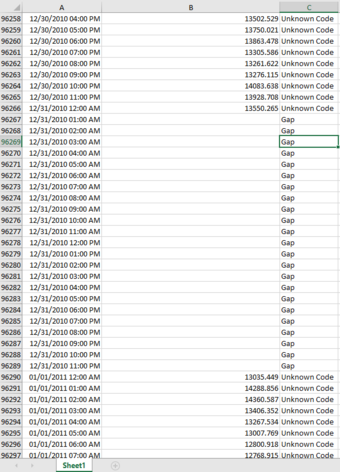
Example 1: A data set showing below has 23 gap points.
5. Gap Counts
The Gap Counts column shows the number of gaps – or the length of continuous gap points – of different time periods.
Example 2: The data set above (see example 1) has 23 gap points but because together they make a continuous gap larger than an hour and less than a day a number “1” is added to the ‘# <= 1 Day’ column.
6. Start Date & End Date
The start date and end date represent the beginning and ending of the complete data series. They are calculated by the database. These dates can be updated via the Data Library -> Workspace ->

How to Use the Summary Report
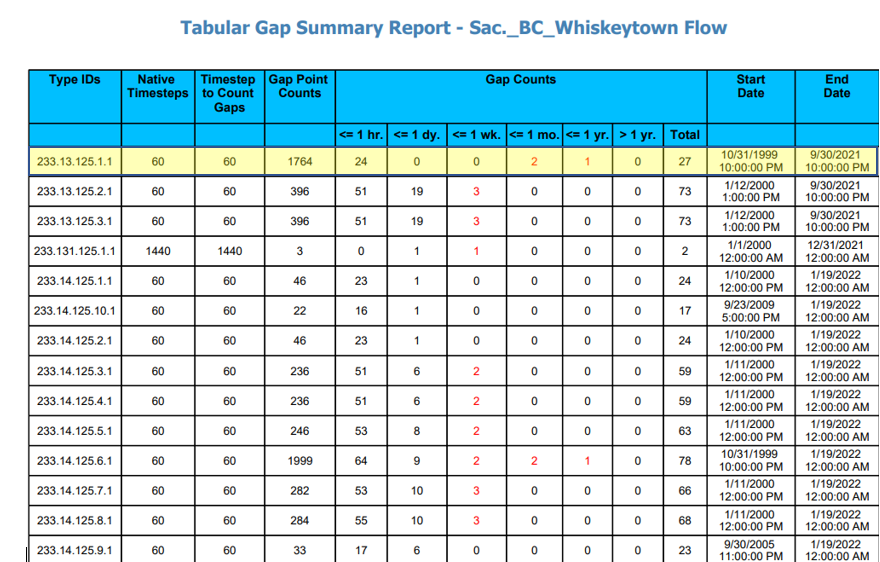
The Summary Report is primarily used to find series with large gaps that may need to be filled with data from outside the database as opposed to linear interpolation which is available in the Data Library (see Gap Handling Tool). To do this you need to look at both the timestep and the size of the gap. The Summary Report will highlight gap counts in red when gaps are larger than 1 day.
Use the Gap Handling tool in the Data Library to graph those series to identify the nature of the gap.
Example 3: In the table above the highlighted row shows three large gaps – 2 less than or equal to a month, and one less than or equal to a year. Examination of the “gap graph” shows these gaps are at the beginning of the series – essentially indicating that the effective date for the start of the series is in 2000 rather than 1999.
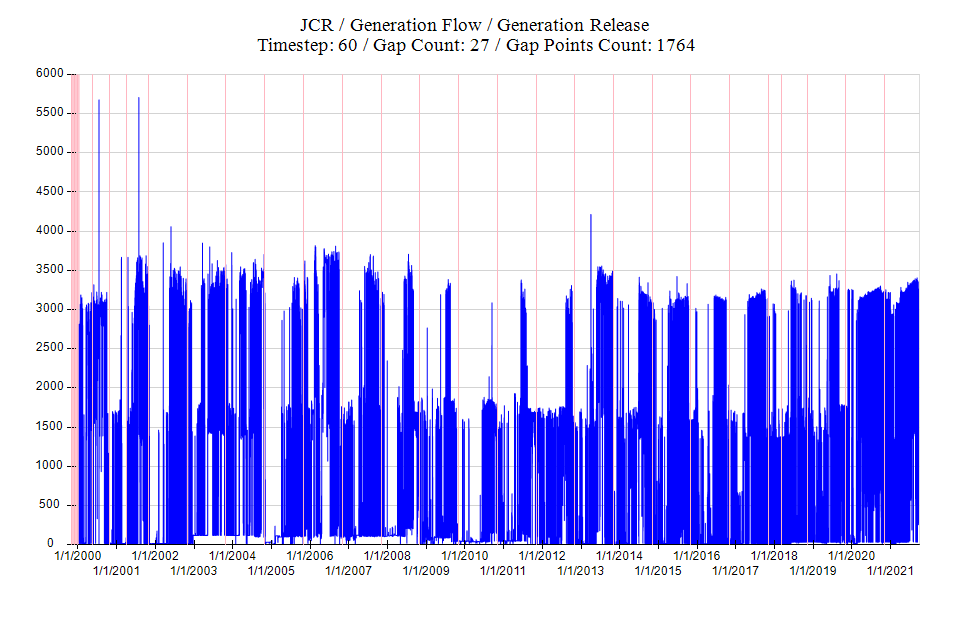
The other gaps are small and can probably be filled by either with “zero” “linear interpolation” or “last known good point”.