Alarms
The Alarms window is used to display and acknowledge alarms caused by readings that exceed pre-set threshold values. Here alarms are ordered by descending date and descending alarm severity.
Acknowledging an alarm will remove it from the table, and from all other alarm displays – including SiteHawk, MerlinMobile and Merlin Enterprise. The User who acknowledged and the time it was acknowledged will be recorded in the MRM database.
The Alarms window with the description of each column is shown below.
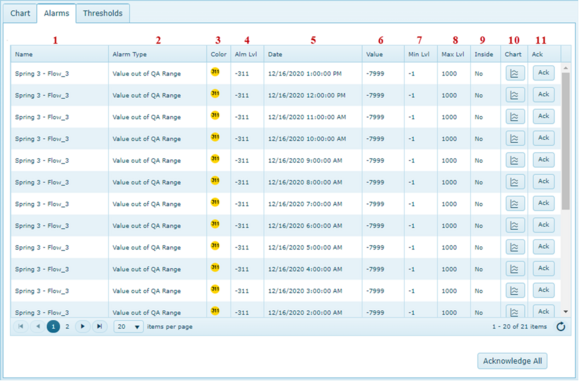
1. ID: This column displays the Type ID the threshold applies to.
2. Alarm Type: The name of the alarm type that is triggered when the threshold parameters are met.
3. Color: This field is used to specify the icon color associated with the alarm definition. This color will appear on the Sitehawk map, the project tree, the emailed Report Definitions, and the Merlin Enterprise real-time graph. The color is set in Merlin Enterprise.
4. Alm Lvl: This value is alarm type number. The higher the value, the more critical the alarm is considered. Best Practice would dictate that higher numbers are used for alarm types that require immediate attention. This value is set in Merlin Enterprise when creating new alarms.
5. Date: This column displays the event date of an alarm. This value is the date the sensor captured the event value, not the date the alarm was processed by Merlin.
6. Value: This column displays the recorded value of the alarm event.
7. Min Lvl: This column displays the minimum level of the threshold that triggered the alarm.
8. Max Lvl: This column displays the maximum value of the threshold that triggered the alarm.
9. Inside: This column displays whether the alarm is triggered when the sensor value is inside or outside the configured thresholds. ‘No’ means a reading outside the thresholds triggers, ‘Yes’ means a reading inside the thresholds.
10. Chart: Click Chart button to open the chart window.
11. Ack: Click the ACK button to acknowledge the alarm.
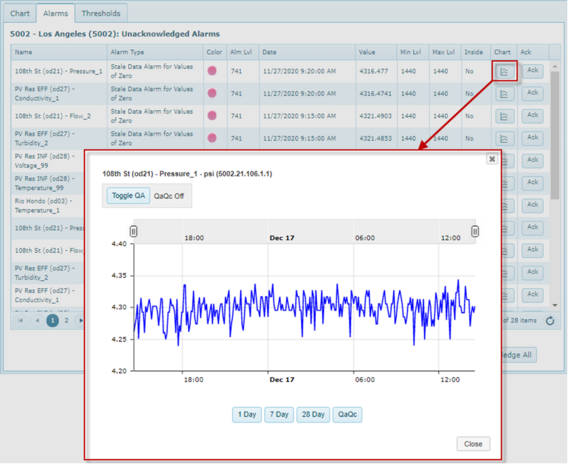
Clicking the Chart icon  in the grid also brings up the 1/7/28 day chart:
in the grid also brings up the 1/7/28 day chart: